Table of Contents
Introduction
Debugging is an essential part of the development cycle. Debugging helps developers identify and fix defects in an application. Thus, performing debugging efficiently and picking a good tool for your debugging needs is an important decision. For example, compile-time defects are easier to understand and fix, but runtime errors can happen on various parameters, including the user input, environment, state of the application, etc.
Time spent on debugging is time away from developing interesting features to add to your application. Therefore, developers are always on the lookout for effective ways to debug code. In this article, we will discuss some useful ways of improving the efficiency of your debugging like using watchpoints or remote debugging methods.
Efficient Debugging
The realistic way of reducing time in debugging is using the right tools and techniques. As deployment models are changing and many SaaS companies are adopting the use of microservices architectures and serverless code deployment, it’s becoming a nightmare for developers to identify defects in code using only the log files.
Developers can run applications written in a high-level language in the debug mode using the command line debugger or the debugger in their integrated development environment (IDE). You can find online articles that tell you more about the types of debugging.
Conditional Breakpoint
Running the application in the debug mode and creating a breakpoint will help you identify the value of the variables. However, if you are iterating a list of objects, hitting the breakpoint, and watching the variables, that is not a very efficient way of doing things. You need to stop at a breakpoint on a line inside the loop only when the element’s value matches a specific value.
Let’s assume you debug a program that has a while loop, and the loop is processing some files. However, you find that during the 10th file, it always fails. Having a breakpoint inside the while will make it hit every time, and you will need to skip it 9 times to reach the 10th file. Instead, you can add a condition for the breakpoint.

Watchpoint
A watchpoint is a breakpoint setup on a variable or field. Each time the variable or field gets changed or used in the execution, the debugger will stop at the variable so the developer can evaluate the value of the variable.
Let’s say we have a counter for the skipped files in the while loop. Instead of debugging line by line, we can add a watchpoint to the variable skippedCount. Then, whenever the application skips a file and increments the skippedCount++, the breakpoint will hit (watchpoint).
Exception Breakpoint
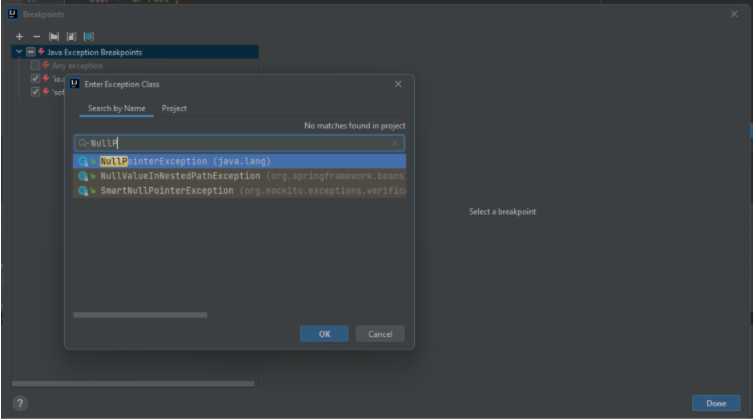
In many cases, there is no point debugging the code line by line. The developer wants to evaluate the stack trace when the specific exception occurs. For example, let’s assume some null pointer exception has occurred in the execution, but the developer wants to identify the defect. Instead of performing line-by-line debugging on all the variables, enable the exception breakpoint and choose the NullPointerException class. The debugger will break when the code throws that specific exception.

Step Filter
While debugging, we developers often step into the code (press F5, which is the default keymap for the eclipse to step into the executing line). If your execution line is calling a 3rd party library that is used by multiple developers or a well-tested library, there is no point in debugging those libraries. We can filter them out in the preferences to avoid wasting time looking for bugs in well-tested or popular 3rd-party code.
Remote Debugging
Usually, developers have control over the test machine and UAT machines. However, when the code is shipped to production, the developer loses direct control over the machine, which makes the debugging stage a nightmare for the developer.
If your production setup is a single agent or application and is running behind a load balancer or microservice-based multi-agent deployment (any distributed systems), you should use remote debugging. Do not rely on log statements.
Remote debugging helps you control the execution during runtime. The developer can debug in the production setup, as well as an application running in a complex deployment.
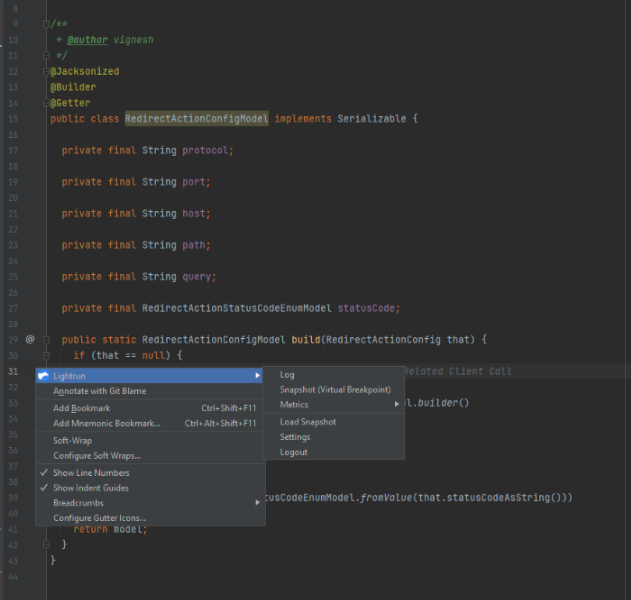
There are some useful tools that let you insert the logs and metrics in the run time to the code, which allows the developer to have control over the execution and observe which variables increase developer productivity, enhance site reliability, resolve bugs faster and debug anywhere.

Conclusion
The most effective way of debugging is avoiding bugs—writing better code, always trying to chunk down complex logic into many smaller isolated units, and writing proper unit tests to verify the correct behavior of your application and keep revising it periodically.
Before starting your application container, always ask yourself: Is there a way to check the behavior with a unit test? There are multiple scenarios where debugging is required. So, use the right tools and techniques to increase your productivity.

